Security Knowledge Graph↑
The AQtive Guard Security Knowledge Graph (SKG) is a powerful feature that provides a comprehensive, interactive map of your security landscape, helping you visualize the interconnectedness of security issues and assets.
Moving beyond isolated findings, it enables interactive exploration to help you understand the full context of an issue such as its connections, origin, and potential impact on other systems.
Demo
Launch our interactive demo: Getting started: Security Knowledge Graph
How it works↑
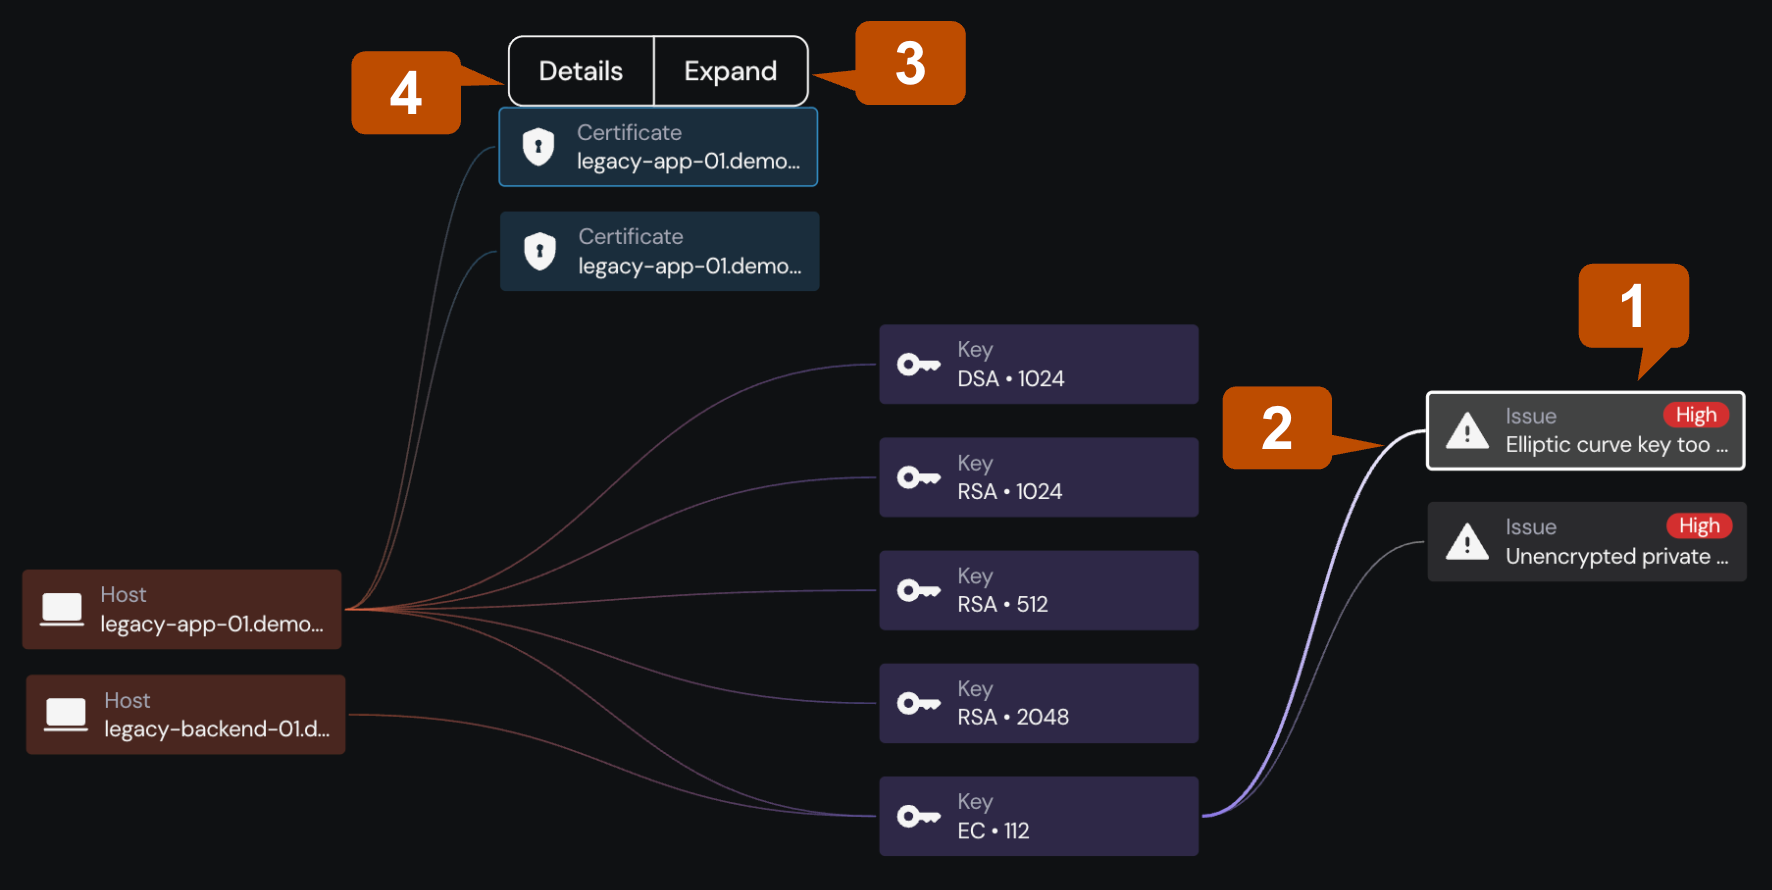
When you’re examining an identified issue (1) within the SKG, it’s represented as a central node. This node serves as a starting point for understanding its relationships within an infrastructure. Selecting an issue node makes its connections to various assets visible by illuminating the edges (2).
You can expand (3) connections to display properties of linked entities. Expanding a connection reveals additional direct links, such as the host system where an asset resides or any associated cryptographic keys. This capability uncovers deeper, related issues that may not be immediately obvious from a list view.
For instance, expanding a linked cryptographic key can reveal a high-severity issue directly associated with that key. From there, you can continue investigating by exploring the connected asset’s details (4) to identify other risks or related components.
Use↑
The two methods of navigating the SKG align with the three primary use cases as follows:
-
Understanding objects related to an issue - this navigation method is used for Root Cause Analysis (RCA). By starting with an issue, you can trace its connections to cryptographic objects, IT assets, and other related entities to find the origin of the problem.
-
Exploring the relationships between objects - this navigation method is used for both Understanding Object Relationships and Blast Radius Analysis. By starting with a specific object (like a key or host), you can explore all its connections to understand its role within the infrastructure and assess the potential impact if it were to be compromised.
Explore issue relationships↑
Issues are interconnected with assets and other objects, forming a network of relationships that provides crucial context for root cause analysis or remediation. For example, expanding an issue in the SKG can reveal the potential impact of a discovered issue.
To explore issue relationships:
- From the main menu, select Issues.
- Locate the issue you want to assess, and select Details at the end of its row.
-
Scroll down to the Security Knowledge Graph to reveal connections to the selected Issue.
Tip
Select the View full screen button in the top left corner of the graph to make the graph easier to see, and use the magnifying glass icons to zoom in or out as needed.
-
Select the connected object you’re interested in learning more about. You can then select its Details to learn more about the object, or Expand to view more direct connections to the selected object.
Tip
If your graph is getting too large to see everything at once, use the Undo button to clear the last node you expanded, or the Reset button to clear all expansions and start over.
Explore object relationships↑
The Security Knowledge Graph enables you to visualize the relationships between cryptographic objects and IT assets, providing a clearer understanding of how they are connected.
Note
The Security Knowledge Graph is available on the following tabs:
- Inventory: Keys, Certificates, Operations, Hosts, Apps, and Files
- Issues
- From the main menu, navigate to either Inventory or Issues, and then select one of the supported tabs listed above.
- Select Graph.
- Select an object to learn more about it. From there, you can select Details to view more about a specific connection, or Expand to reveal more direct connections.
Tip
- Select the View full screen button in the top left corner of the graph to make it easier to see.
- If the graph gets too large, use the Undo button to clear the last node you expanded, or the Reset button to clear all expansions and start over.
Real-world example: Blast radius analysis↑
The SKG provides a powerful method for incident response by enabling you to perform a blast radius analysis. This workflow helps you quickly identify the potential scope of impact when an IT asset or cryptographic object is known or suspected to be compromised.
To begin, select the compromised entity as the starting point for your investigation.
-
Establish the analysis epicenter - Navigate to the relevant AQtive Guard inventory list (for instance Hosts or Keys under Inventory). Then, select the compromised entity such as a host, a private key, or a certificate to serve as the epicenter of the blast radius analysis.
-
Visualize the immediate connections - From the entity’s details view, launch the SKG. The graph automatically centers on your selected entity, enabling you to explore its direct connections. These connections represent cryptographic objects, applications, and IT assets that depend on, use, or are otherwise directly related to the epicenter.
-
Assess the potential impact - From the initial view, you can interactively expand the graph to see connections beyond the first hop. This reveals secondary dependencies and other potentially affected entities. By visualizing these relationships, you can quickly identify the full potential scope of the compromise, including other hosts or applications that share the same credentials.
-
Prioritize response actions - The visual map of at-risk assets allows you to prioritize and take immediate action. You can use the information from the graph to inform decisions such as credential rotation, system isolation, and further investigation to effectively contain the incident and mitigate the risk of a wider compromise.